
I was very impressed when watching Raj Chetty’s video presentation in the AEA panel “The Economic Impact and Policy Response to the Pandemic: What Happened in 2020 and What is Ahead?”. He is part of a group (Chetty, Friedman, Hendren, Stepner, and the OI Team) that convinced several private sector companies to make publicly available important data that allows to track in detail the economic impact of Covid-19 in the US with a much smaller time-lag than official statistics.
All data is publicly available on this Github repository and it can be explored interactively on tracktherecovery.org. Here is a graph of the change in employment for different income groups:
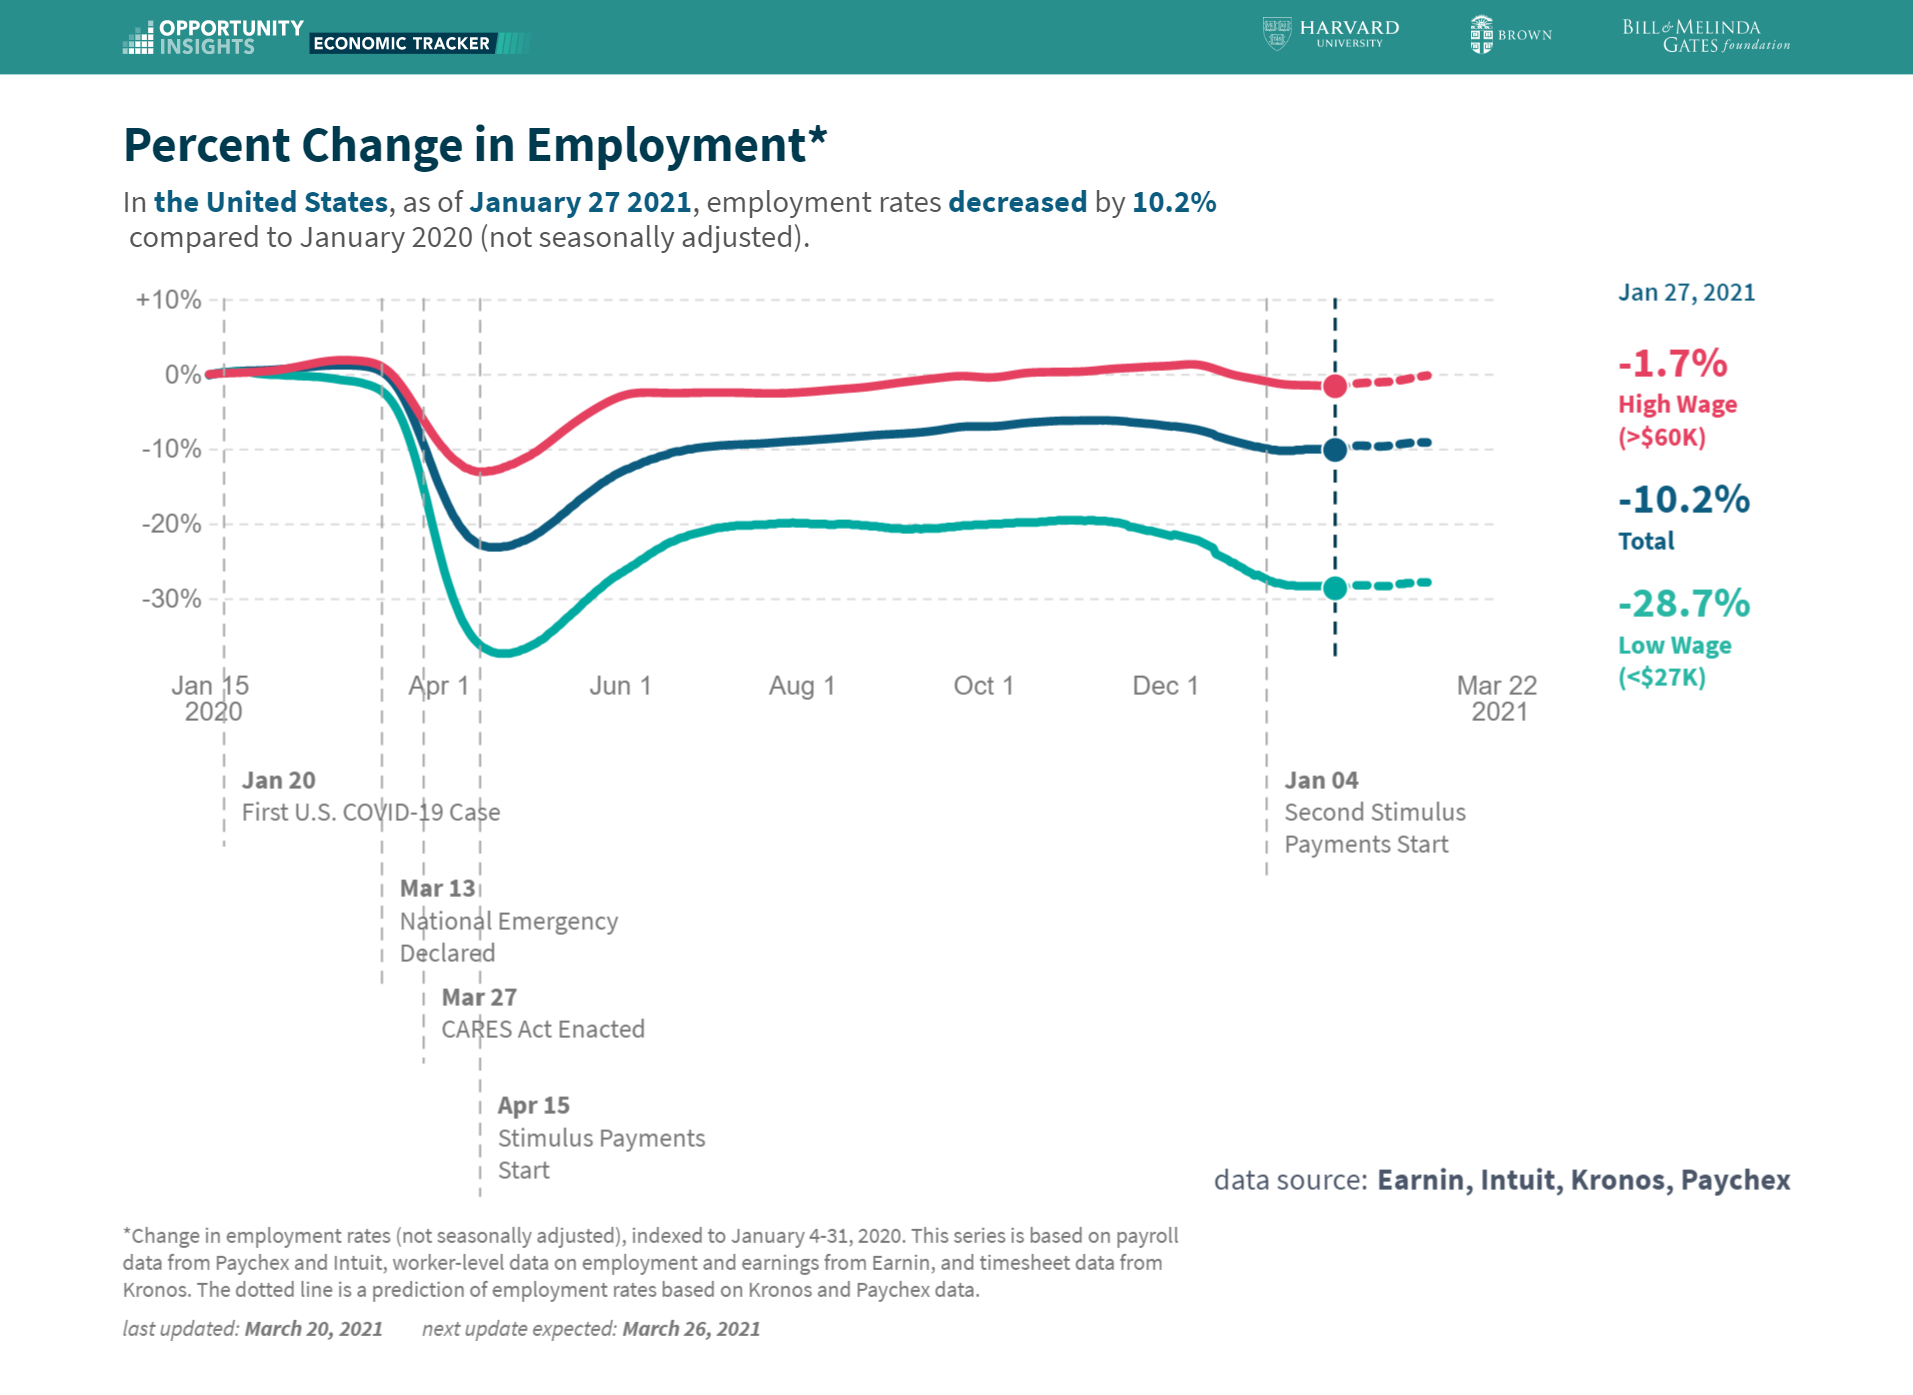
You see how many more low wages jobs were lost than high wage jobs. Such numbers are of course very important when designing Covid relief packages.
In contrast, small businesses located high income ZIP codes lost more revenues:
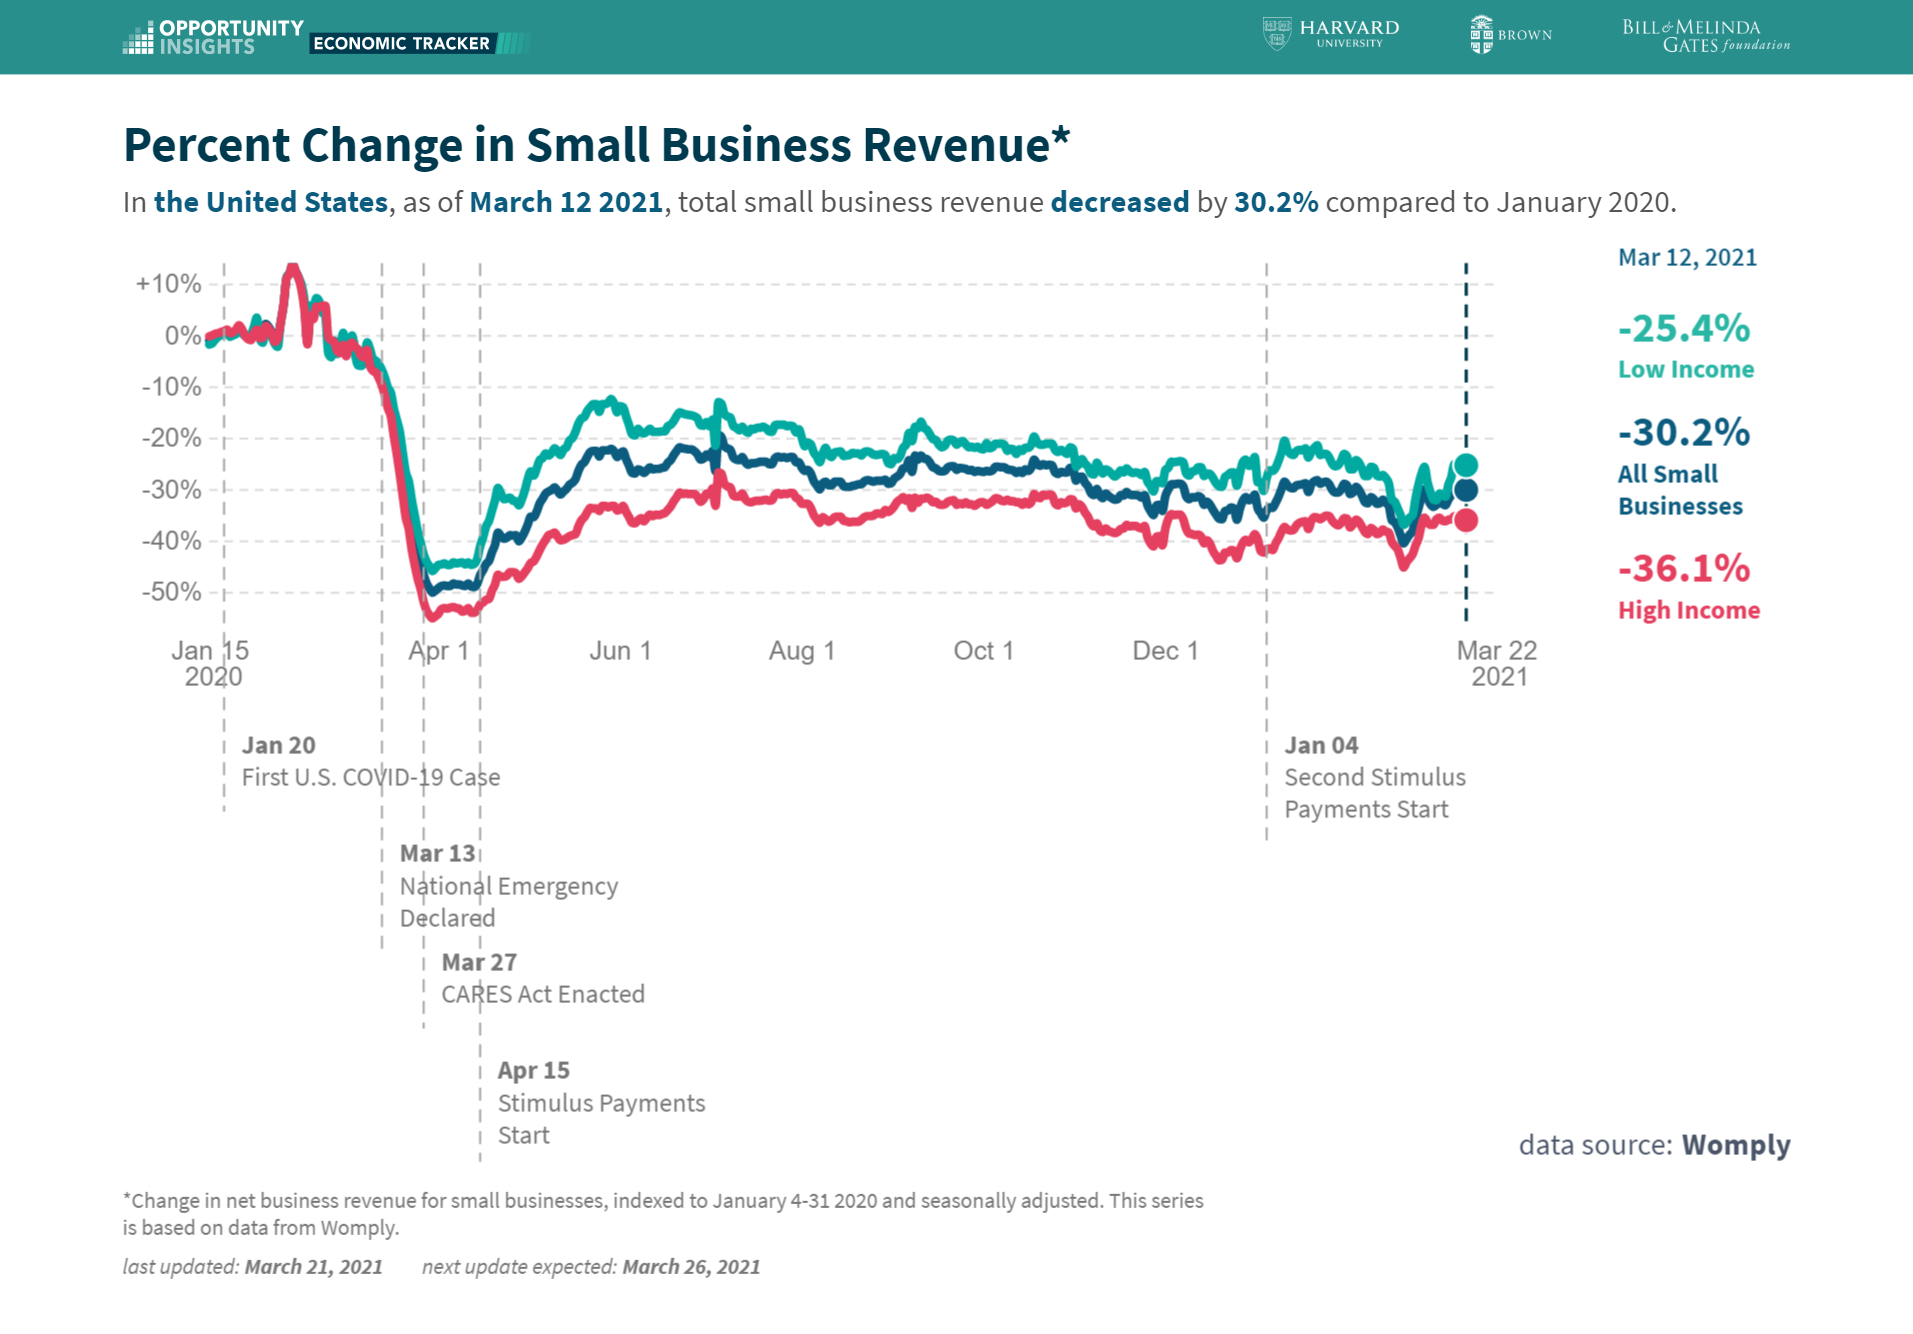
One reason could be a higher propensity of richer households to use online shopping. One can also explore the revenue impacts on a map:
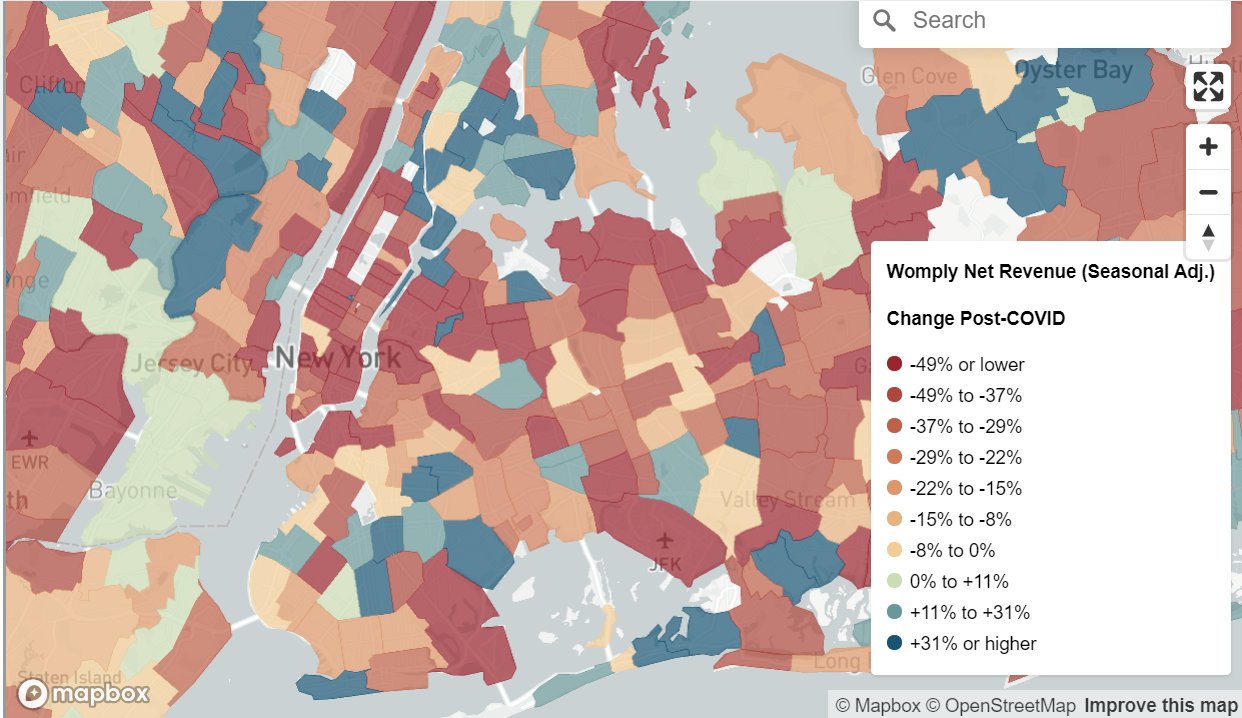
The map may suggest another reason: high income areas in cities are often areas with many offices whose employees largely work from home during the crisis. Again, I encourage you to take a look at the video presentation for Raj Chetty’s interpretation, insights and recommendations based on the collected data.
Normally, I would now add a small analysis in R with the data set. However, since analyzing that data is a topic in my current empirical economics seminar and another student is going to write an interactive RTutor Master thesis about the working paper, I will abstain from it.
Published on 22 Mar 2021 •