
German wholesale electricity prices in August 2022 are extremely high with an average of 397 Euro / MWh (EPEX day ahead prices until 19th of August). That is more than 10 fold the average prices in 2019 (38.3 Euro / MWh) and 2020 (31 Euro / MWh). There are several reasons. The NY times summarizes here:
The dry summer has reduced hydropower in Norway, threatened nuclear reactors in France and crimped coal transport in Germany. And that’s on top of Russian gas cuts.
To get a better quantitative intuition, I collected some long run time series data and want to present it in this post. Here is a first glimpse at the data set:
##   date       co2_eur_t el_eur_mwh gas_eur_mwh coal_eur_mwh oil_eur_mwh usd_eur
## 1 2011-01-01      NA         22.0        NA           NA          NA     NA
## 2 2011-01-02      NA         44.5        NA           NA          NA     NA
## 3 2011-01-03      20.0       61.6        24.0         15.3        42.0    1.34
## 4 2022-08-17      96.4      555.        226.          60.7        52.5    1.02
## 5 2022-08-18      96.5      569.        241.          61.2        53.2    1.01
## 6 2022-08-19      98.4      506.        245.          61.9        55.3    1.00
(I have omitted the R code in this post. The RMarkdown document with code is here)
The daily data from 2011 to August 18th 2022 contains the price of EU carbon certificates, German electricity prices, and fuel prices converted to Euro per MWh thermal energy for European natural gas, hard coal and crude oil. The appendix gives more insight how this data set was collected. You can download the data set here.
Let us look at 4 time series using for better visualization weekly aggregated data:

Not only electricity and natural gas prices have massively gone up in 2022 (starting already 2021), but also coal and carbon prices increased. To get a better insight into the relative importance of the different fuel prices and the carbon prices for the electricity price increase, I want to compute the time series of approximate variable cost for different power plant types using the simple formula:
variable cost = fuel cost + cost of carbon allowances
For that calculation, we need some technical power plant data, like efficiency and carbon emissions. Such numbers for representative plants are regularly specified in energy market models. The following data set uses the specifications from the DIW energy market model Dieter:
##       plant efficiency carbon_content
## 1     hydro      0.900          0.000
## 2   nuclear      0.337          0.000
## 3   lignite      0.447          0.399
## 4      coal      0.464          0.337
## 5      CCGT      0.610          0.201
## 6      OCGT      0.393          0.201
## 7       oil      0.410          0.266
## 8     other      0.537          0.269
## 9       bio      0.468          0.000
## 10  wind_on      1.000          0.000
## 11 wind_off      1.000          0.000
## 12       pv      1.000          0.000
Using that specificaion and the price data from above, we compute for every week in our data set the approximate variable cost for 4 different plant types:
-
Open Cycle Gas Turbine (OCGT)
-
Combine Cycle Gas Turbine (CCGT)
-
Hard coal power plant
-
Oil power plant
We now plot the resulting approximated variable cost and compare it with the electricity price from 2011 to 2020, a period in which prices remained relatively stable:

We see how until 2018 variable costs of coal power plants were general below the average electricity prices and below the variable costs of combined cycle gas turbines (CCGT). Yet, with increasing carbon prices this ranking swapped as is particular visible in 2020.
Note that the variable cost of the classic peak load plants open cycle gas turbine and the much less used oil plants are consistently above average weekly electricity prices. This does not imply that those plants make losses, though. Peak load plants typically only run in hours with sufficiently high demand (net of wind and solar production) and in those hours electricity prices are well above the weekly average.
Let us now look at the same graph for the period from 2018 to August 2022:

Starting from the 2nd half of 2021 we see a massive increase in particular for the variable costs of peak load gas turbines (OCGT), reaching more than 600 Euro / MWh at the end of August. Also the variable costs of the more efficient combined cycle gas turbines reach 400 Euro / MWh. Indeed the variable cost of CCGT track quite well the average electricity prices. While the variable costs of coal plants have also strongly risen, the level of 200 Euro / MWh is substantially below that of the gas power plants. Interestingly, completely reversing the usual ranking, oil power plants had the lowest approximated variable costs at the end of our time series, slightly below 200 Euro / MWh. (As explained in the appendix, I did not get data for actual furnace oil prices and used crude oil prices instead. If furnace oil is more expensive, coal plans may actually still a bit cheaper than oil plants. Also there is very little capacity of oil power plants.)
The following plot separates the variable cost into costs for carbon certificates (dark shaded) and fuel costs. We first limit the price axis between 0 and 100 Euro and show the years from 2015 onward:

The plot shows that in normal times the increase in carbon cost from 2021 onward, would already be quite substantial. For coal the carbon cost in 2022 exceed the total variable costs before 2021. But let us now look at the same plot without limiting the price axis:

We see how for OCGT and CCGT gas power plants, the increase in natural gas prices has much higher impact on the variable costs than the increase in carbon prices. Also for coal power plants the coal price increase seems more important than the carbon price increase even though the effects have a more similar size that for gas power plants.
Electricity future prices
I was not able to collect time series data on electricity future prices. Looking at the actual EEX future prices we find very high prices but very little trade. Here is a screenshot for the quarterly base load future prices:
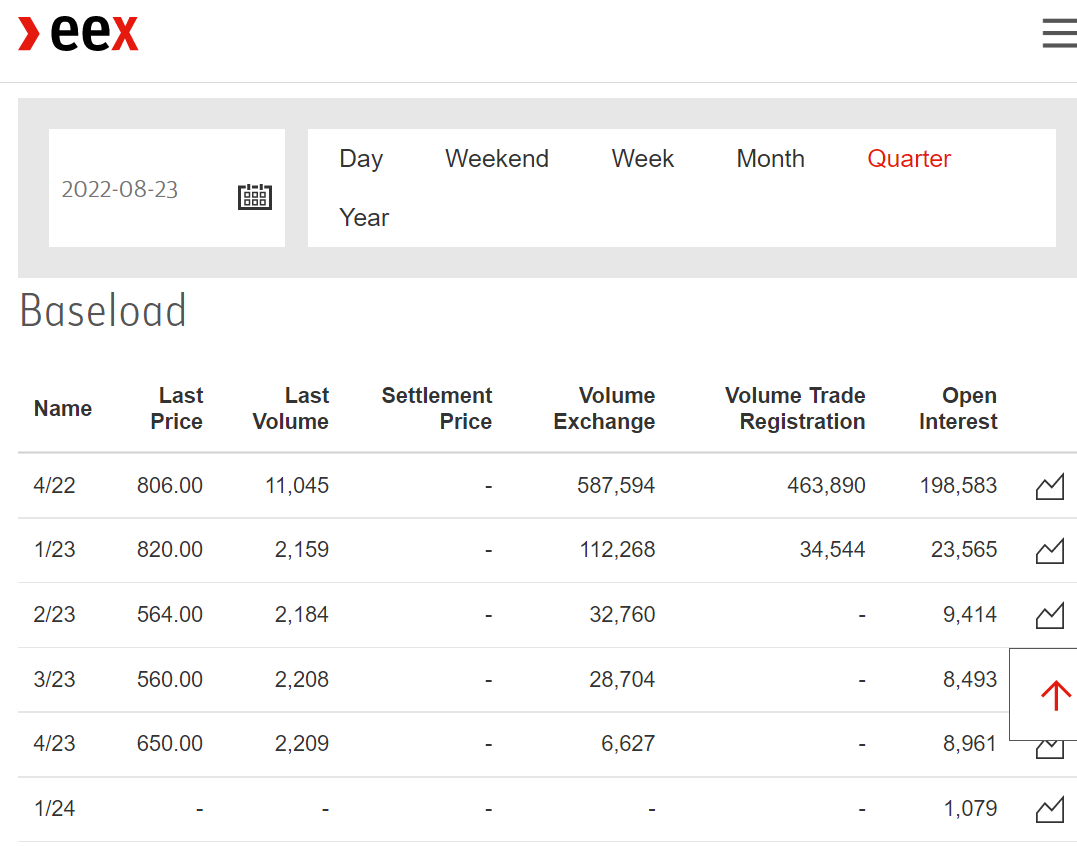
Given the little trade volume, the hopeful interpretation is that these extremely high future prices don’t display robust expectations by market participants, but that they are rather an indicator of huge uncertainty about future prices making nobody willing to sell electricity at low prices.
Discussion
Energy prices are a huge political challenge. As we saw, it is not only about natural gas prices, but also about electricity prices. We must implement effective mechanism that keep strong price signals in order to reduce gas and electricity demand but we also need strong support for households with low income.
The proposals are there (e.g. pay a lump sum transfer based on a household’s last year’s consumption while keeping current prices high). Yet, for natural gas German government currently only proposed a general tax cut. A tax cut has awful incentive properties (we need high prices to reduce demand) and is an extremely expensive and little effective method to support the households most in need. I don’t exactly know whether politicians just don’t want to use better concepts, because they sound too complicated and seem harder to sell to voters or whether our administration would just be unable to implement them…
Then, of course, it is not only households, but also industry. A lot of firms already made sensible short-run steps, like substituting natural gas with oil but that does not always work as fast as desirable. But if in addition to soaring gas prices, electricity prices remain at levels ten times above the levels in earlier years, that may be really hard to cope with for many firms. At this point I have not yet thought deeply enough how to best support the industry to cope with such prices and abstain from discussing different proposals.
OK, one point seems really obvious. I sincerely hope that some common sense will prevail in our government and we won’t shut down in this situation the last three running German nuclear reactors at the end of this year. Of course, these three nuclear plants don’t solve the problem alone, but we need every effort to save energy and use alternatives to Russian gas.
In a recent statement Robert Habeck, Germany’s secretary of economics, stated he won’t keep the nuclear plants running in order to reduce natural gas consumption, as this would save at most 2% of total natural gas consumption. But 2% of total consumption is already 10% of the 20% reduction goal and 10% of the goal is actually quite substantial. Well, at least he has not yet ruled out that nuclear plants may stay running for other reasons (i.e. to stabilize electricity supply).
And of course, the incentives to build solar and wind plants are huge, but that takes time. In particular, now, delivery times for solar modules are fairly long…
While Putin is rejoicing at these prices, I sincerely believe that reducing the military support for Ukraine (which seems already too low) or opening North Stream 2 would be much more costly in the long run. If Gazprom wanted to honor its supply contracts, it could do so already now. There is enough unused capacity in North Stream 1 to delivery the gas. Why should Putin stop his pressure if we would agree to open up North Stream 2? It would just stabilize Putin, give him more money he can use to kill Ukrainians, and convince him further that aggression is the right strategy.
Appendix: Fuel Price Data
I retrieved carbon prices and most of the fuel price data from www.investing.com, which allows free download of historical data. More precisely the links are:
Coal prices (Newcastle coal futures)
https://www.investing.com/commodities/newcastle-coal-futures-historical-data
The prices are given in USD per tonne coal. There are different numbers one can use for converting a tonne of coal into MWh of thermal energy. Based on the numbers here:
https://world-nuclear.org/information-library/facts-and-figures/heat-values-of-various-fuels.aspx
I used 6.7 MWh energy per tonne of coal, which lies between the stated 25 MJ/kg (6.944 MWh) and 23.9 GJ/kg (6.638 MWh).
The conversion of USD into EUR was performed using historical exchange rate data downloaded here:
https://www.investing.com/currencies/eur-usd-historical-data
(The same for oil prices). Ideally, I would have spot market prices instead of future prices. But I hope / believe that these are very near term future referring to deliver e.g. in the next month. (The same applies to the natural gas prices)
Natural Gas Prices
Here I took the prices of ICE future on the Dutch TTF:
https://www.investing.com/commodities/ice-dutch-ttf-gas-c1-futures-historical-data
As far as I checked, the prices are already given in EUR / MWh, so no conversion was necessary.
Oil prices
I took crude oil prices from Yahoo finance using the following R code:
library(tidyquant)
crude_oil = tq_get("CL=F",from = '2000-01-01',to = Sys.Date())
crude_oil$oil_usd_mwh = crude_oil$open / 1.6282
where the factor 1.6282 is for the conversion between barrels oil equivalent to MWh. Oil power plants seem to use so called furnace oil which is not identical to crude oil, for which the prices were collected. In my moderately long web search, I could not find information on the relationship of both prices, so I simple assumed they have roughly the same price.
Published on 23 Aug 2022 •