
Putin’s brutal attack on Ukraine is horrifying in many dimensions. The western world reacted with economic sanctions on Russia, which seem to have strong effects mainly by limiting Russia’s imports (see e.g. this recent online presentation by Nobel-prize winner Paul Krugman at the Kiev School of Economics).
Still European countries are importing huge amounts of Russian natural gas and its price has skyrocketed. A situation in which Russia can boost its revenues from natural gas sales by driving up prices with its war is clearly very bad. Even if, overall, the attack massively harms Russia, we should make sure that high revenues from natural gas sales do not positively enter Putin’s calculation to continue the killing in Ukraine.
In this post I want to show some numbers and discuss some thoughts. After highlighting several important topics, like the structure of long-term contracts, in the end I will mainly argue for tariffs on natural gas imports from Russia as instrument that should be seriously considered and be quickly prepared. (R code to generate some of the graphs is in an Appendix at the end).
Quantities
Let us first look at the recent development of Russian natural gas exports to Europe:
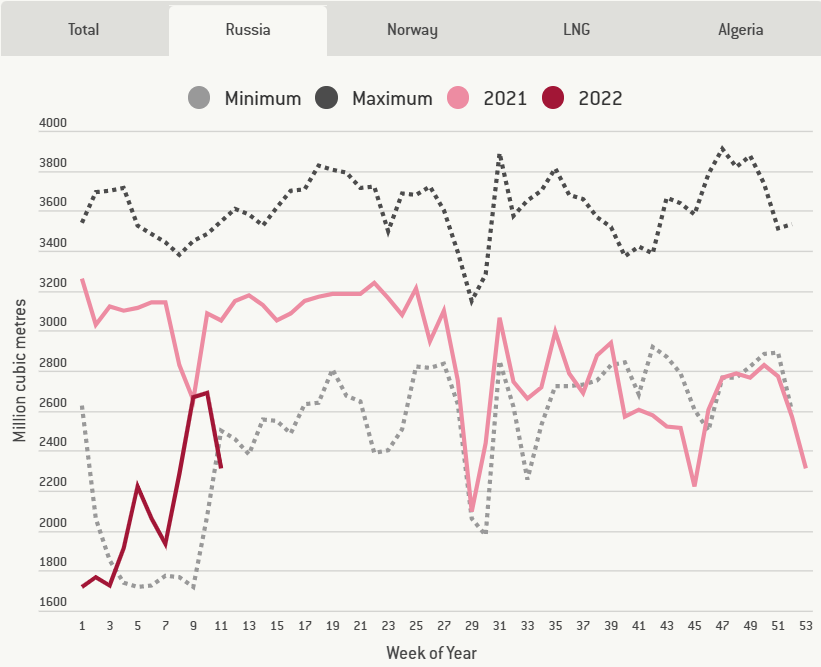
Source: bruegel.org. The minimum and maximum quantities are computed for the years 2015-2020
We see how the exported quantities throughout the 2nd half of 2021 and the beginning of 2022 were fairly low compared to earlier years. Note that in February and March 2022 quantities initially increased again even with the beginning of the attack in calendar week 8.
I found the following figure from EU’s detailed Quarterly Report on European Gas Markets particularly striking:
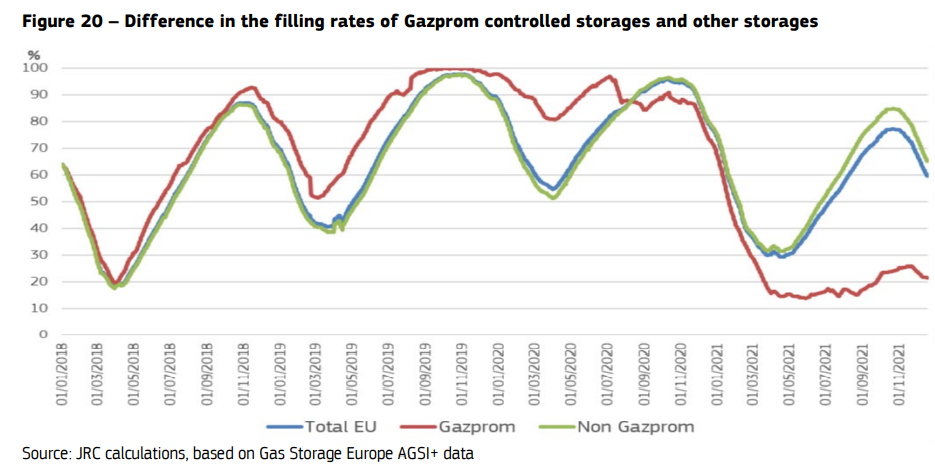
Unlike other EU gas storage operators, Gazprom left its European natural gas storages at an extremely low level from spring 2021 onward. In hindsight, this seems quite consistent with a strategy to put the EU in a more vulnerable situation when Putin started his invasion.
One reaction is that Germany and the EU plan to prescribe minimum storage levels before winter. (With the downside that this measure likely increases today’s gas prices.). Despite this measure, looking at the figure above, I cannot perceive how the EU sensibly could still allow Gazprom or another Russian controlled company to operate gas storage facilities in the EU in the future.
Prices
Let us look at European natural gas prices:

Source: Own illustration with data from Yahoo Finance. See R code in the appendix.
The figure shows the prices at the most liquid European natural gas trading hub, the Dutch TTF. We see how the price increased strongly throughout 2021 and and then again with the attack starting on February 24th (dashed vertical line). It then went down again but remained at a very high level.
Th following figure shows the average monthly prices from 2021 onward relative to the average price from 2018 to 2020:

In March 2022 natural gas prices on the dutch TTF hub were almost 9 times higher as the average price from 2018-2020. If prices would stay so high (unlikely given the drop a few days after the invasion) and also carry over to Gazprom’s long-term delivery contracts (discussed below), even a reduction of Russian’s natural gas exports to 25% of the pre-war levels could mean twice as much yearly revenues than the average in the years 2018 to 2020.
It is not easy to determine which part of the price increase, starting already in 2021, is caused by Putin’s aggressions. Also other factors like strongly increasing energy demand by China and India in 2021 that caused a huge increase in coal prices (see e.g. this IEA report), surely also play a role. For one comparison, the following plot shows the development of natural gas prices in the US:

We see that price levels are overall much lower than in Europe. The following plot shows also that the relative price increase compared to the 2018-2020 average was much smaller than in Europe:

This at least suggests that Putin’s aggression is a quite substantial factor in the increase in European natural gas prices.
Long-Term Contracts
It was hard to find exact data on how much of gas imports from Russia are conducted under long-term contracts compared to spot transactions. This study by the Oxford Institute for Energy Studies reports for 2019 that almost 90% of Gazprom sales in Europe are conducted via long-term contracts (using Gazprom’s reported numbers).
These long-term contracts don’t specify fixed prices, but rather stipulate obligations to supply and take minimum quantities (take-or-pay provisions). In the past, prices mainly followed the development of the oil price (oil indexation). Nowadays, the majority of long-term contracts with Gazprom is indexed on the price on the TTF hub for natural gas. (While official Gazprom numbers reported here state that in 2019 56% of Gazprom’s sales use hub-indexed pricing, this report states that Gazprom tends to under-report the share of hub-indexed contracts and estimates already for 2015 a share of 70% hub-indexed long-term contracts.)
Given Russian’s ability to strongly increase the hub price, e.g. by reducing its supply on the spot market or by starting wars, indexing a large share of long-term contracts on the spot price seems highly problematic in hindsight.
In theory, if a very rationally forward looking, centralized EU agency negotiated the contracts with Gazprom, one should hope that there would be contract clauses that impose price caps for events like an Russian attack that let hub prices skyrocket. I don’t know how the actual contracts look like in detail, but I fear that the actual contracts between Gazprom and European firms don’t have such stipulations. So Russia may indeed get huge prices for their natural gas sales under the current long-term contracts.
Russian Revenues from Oil and Natural Gas Exports
How important are oil and natural gas exports for Russia’s revenues? As Reuters summarizes here, in 2021 oil and natural gas exports accounted for 36% of the Russian state’s budget. From total oil and natural gas exports revenues, roughly 25% are revenues of natural gas exports (mainly to Europe) and 75% are revenues from exports of crude oil and oil products. This means oil is a substantially bigger factor in Russia’s revenues than natural gas, but it is probably also easier for Russia to sell oil outside Europe than natural gas. In this post, I will continue focusing on natural gas and leave out a deeper discussion of oil. That is not because oil might not be much more important, but because I currently just know too little about the oil market.
What to do?
So how should the EU act with respect to natural gas imports? I don’t know the best strategy, but still want to share some thoughts.
Some things seem relatively clear cut. The EU should become less dependent on Russian gas imports. Some measures are building more LNG terminals, actively seeking out alternative suppliers, greatly intensifying renewable energy investments and energy-savings investments, but also rethinking carefully current time paths for phasing out coal and nuclear power plants. Many of these points are e.g. explained in the IEA’s 10-Point Plan to Reduce the European Union’s Reliance on Russian Natural Gas.
But should we already now limit / forbid natural gas imports from Russia or impose tariffs on them? Here are thoughts on 4 options.
Option: Not yet reduce natural gas imports from Russia
One option is not yet to actively limit the natural gas imports from Russia, while still taking urgent steps to become less dependent on those imports. One motivation for this option would be to fill EU’s gas storages as much as possible before next winter in order to avoid to be in a very weak position then. The drawback is that Russia gets with every day substantial revenues, at very high prices, that help Putin waging his war in Ukraine.
Option: Slowly reducing natural gas imports from Russia
Another course is to actively start already now to slowly reduce natural gas imports from Russia, e.g. by motivating European firms not to buy Russian natural gas beyond existing contracts.
While this course may look like a natural middle ground between a full stop and no immediate reduction, there is an important drawback. Actively reducing Russian imports likely drives up today’s prices and thus may even increase Russia’s total revenues. As the numbers shown above suggested, price swings may be quite substantial, so substantially reducing Russia’s revenues by partially reducing imported quantities may be not easily achieved.
I am thus skeptical about that strategy, unless the counter-veiling effect of price increases could be somehow tackled (like with tariffs suggested below).
Option: Complete Stop of Natural Gas Imports from Russia
One possible action of either the EU or Russia is to immediately, completely stop Russian natural gas deliveries to the EU.
As I understand, several EU leaders, e.g. in Germany, fear that such a step would hurt the EU substantially more than Russia. This is really hard for me to assess. There are studies like this study, looking at Germany, suggesting that there is a good chance that impacts are quite moderate and could be well handled. But actual effects might be substantially stronger than the study suggests. Actively taking this step as EU may be quite risky and possibly erode public support for sanctions.
Furthermore, imposing a complete stop of natural gas imports now, has the drawback that there remains little threat of additional sanctions should Putin escalate even further the brutalities.
Option: Impose tariffs on natural gas imports from Russia
This option most directly addresses the point that Putin should not benefit from his aggression by higher natural gas prices: The EU imposes a tariff on imported natural gas from Russia.
For example, if the EU imposes a tariff of 50 Euro / MWh on Russian gas imports, Gazprom should get 50 Euro / MWh less than other suppliers of natural gas. While this would likely also increase price for end consumers, Gazprom is unlikely to completely shift the tax burden to consumers, since other gas suppliers won’t have to pay the tariff and demand is not completely inelastic. In a normal market, such a tariff should reduce both the price Gazprom gets and the amount of natural gas it sells. If implementable in practice, one could also think of designing a variable rate tariff whose rates are indexed on the hub price in order to target a fixed price that Russia receives when selling its natural gas.
The tariff income could be used to partly reduce the burden of high energy prices for low-income households or industry.
I honestly don’t know, how quickly such a tariff can be implemented and don’t know all legal implications.
An important aspect is that it would not suffice to only subject new contracts and spot market trades to such a tariff but also existing long-term contracts in a way that Gazprom only receives the contracted price minus the tariff. Otherwise, the payments Russia receives for its long-term contracts would even increase as such a tariff likely increases long-term spot prices.
In essence, this would mean the EU declares to pay a lower price per unit delivered natural has than is contracted in the long-term contracts. This could be interpreted as a breach of the contracts. However, with such a step the EU may not have been the first party to breach the long-term contracts. On March 23rd Russia announced that it will only accept payment in Rubles for its natural gas deliveries, which many observers already interpret as a breach of the long-term contracts (see e.g. this Politico article).
Independent of the legal aspects, imposing such a tariff could cause Putin to reduce or completely stop natural gas supplies to the EU. This is definitely a risk to be taken into account.
One consequence could be that all long-term contracts are cancelled, while at some point certain amounts of natural gas might be supplied again on spot markets. Getting rid of hub-indexed long-term contracts with Gazprom might anyway be desirable in the longer run to reduce the EU’s dependency on Russia and to make the European market more attractive to alternative suppliers (see e.g. this Bloomberg article on corresponding goals by the EU already in December 2021).
So even if the introduction of a tariff may initially cause a strong supply reduction by Russia, the advantage of a tariff is that then both the EU and Russia have an instrument that allows for a dosed response that can be tightened or relaxed depending on the diplomatic relationship and development in Ukraine. Russia could adjust its supply in small steps, the EU can adjust its tariff / price cap in small steps.
In contrast, imposing a limit on the demanded gas quantities from Russia would not be an effective instrument for a dosed response for the EU, because such a quantity cap poses the risk of higher prices that offset Russia’s revenue losses.
Appendix: R code
I used the package tidyquant to download the natural gas price data from Yahoo finance:
library(tidyquant)
# European Hub price (ttf)
dat = tq_get("TTF=F",from = '2018-01-01',to = Sys.Date())
dat$price = dat$open
saveRDS(dat, "ttf_prices.Rds")

# US Hub price
dat = tq_get("NG=F",from = '2018-01-01',to = Sys.Date())
# Transform price in USD per MWh (as TTF price is in Euro / MWh)
dat$price = dat$open * 3.412141633128
saveRDS(gas, "gasus_prices.Rds")
Then I generated the plots using dplyr and ggplot2. Here is the code for the two plots on European TTF prices:
library(dplyr)
library(ggplot2)
library(lubridate)
dat = readRDS("ttf_prices.Rds")


ggplot(dat, aes(x=date, y=price)) +
  geom_vline(xintercept=as.Date("2022-02-24"), color="#333388", linetype="dashed") +
  geom_line() +
  ylab("Euro / MWh") +
  ggtitle("Natural Gas European Hub Price (TTF)") +
  theme_bw()

# 2nd plot: monthly average prices relative to average from 2018-2020
dat$year = year(dat$date)
dat$month = month(dat$date)
dat$ym = (dat$year-2000)*100+dat$month

agg = dat %>%
  group_by(year, month, ym) %>%
  summarize(price = mean(price, na.rm=TRUE)) %>%
  mutate(date = as.Date(paste0(year,"-",month,"-01")))

base = agg %>% filter(year >= 2018 & year <= 2020)
base.price = mean(base$price)

agg = agg %>%
  mutate(base.price = base.price, index = price / base.price)


ggplot(agg %>% filter(ym >= 2100), aes(x=date,y=index, label=round(index,1))) +
  geom_col() +
  geom_text(nudge_y = 0.5) +
  geom_hline(yintercept=1) +
  ggtitle("TTF Natural Gas Prices (relative to 2018-2020 average)") +
  ylab("") + xlab("")
Published on 24 Mar 2022 •